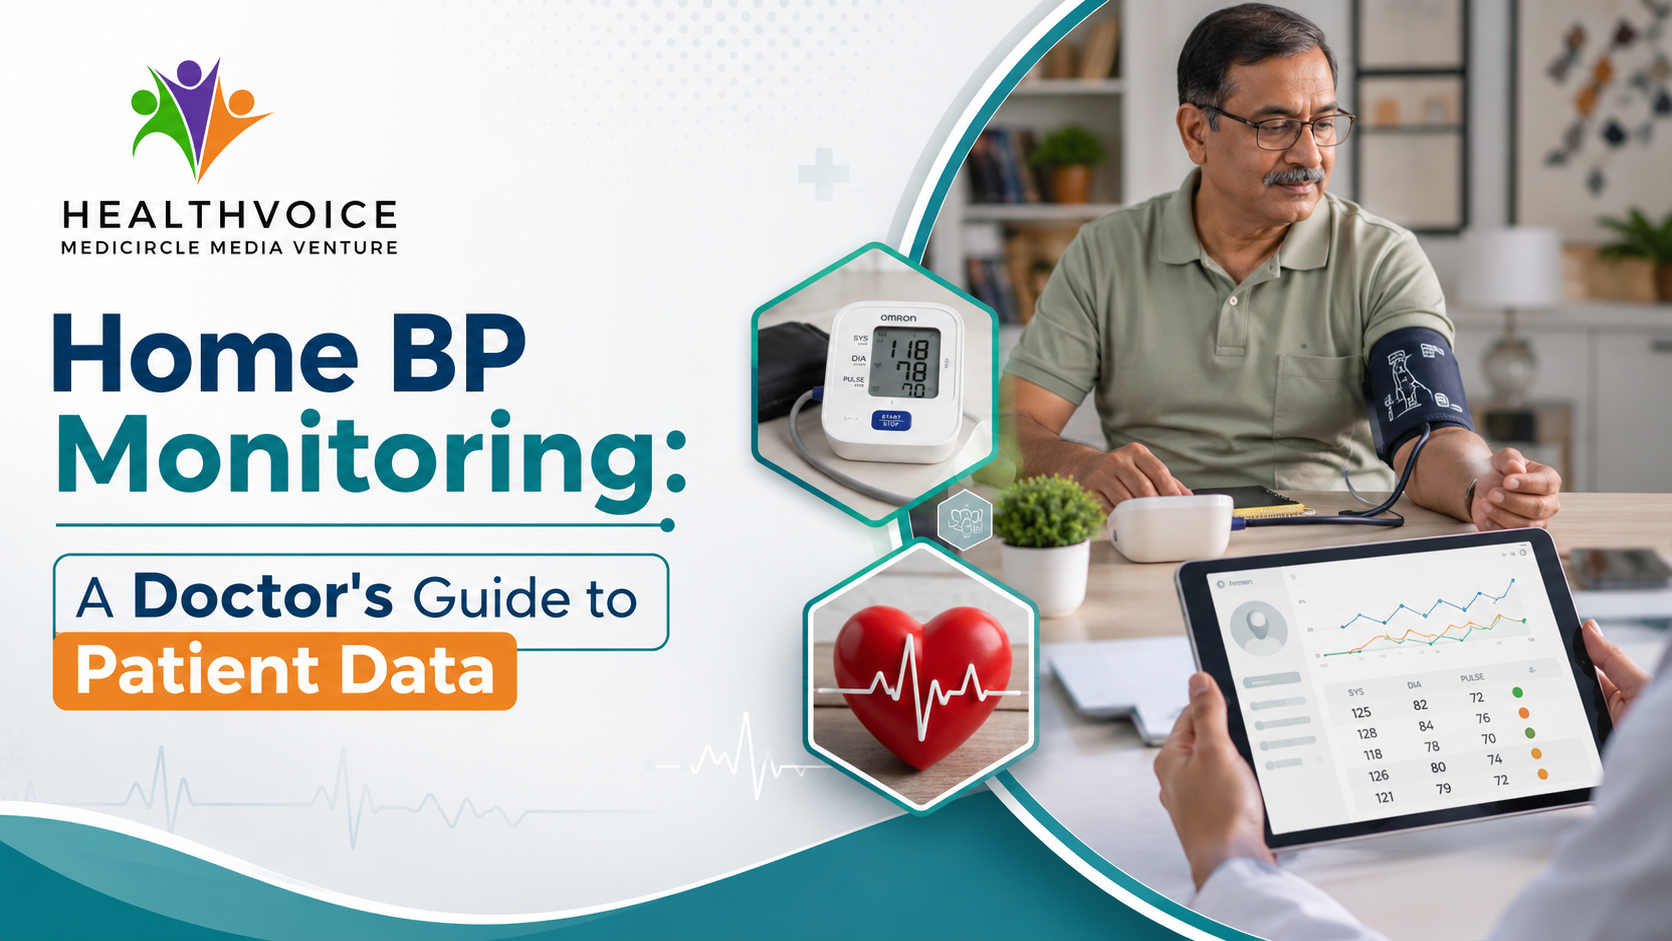
Home BP Monitoring: A Doctor's Guide to Patient Data
This article outlines a structured, evidence-based workflow for Indian doctors to review, interpret, and act on patient-generated home blood pressure data during hypertension follow-up visits.
Home BP Monitoring: How Doctors Can Use Patient-Generated Data Effectively
Introduction
Hypertension management in India has reached an inflection point where a single clinic reading is no longer sufficient to guide treatment decisions with confidence. The ICMR-INDIAB study places national hypertension prevalence at 35.5 percent among adults, with the burden rising steeply past the age of 60, and a large share of patients remaining undiagnosed, untreated, or inadequately controlled despite regular follow-up visits. Home blood pressure monitoring has emerged as one of the most practical tools available to close this gap, yet its clinical value depends almost entirely on how effectively a physician incorporates that patient-generated data into decision-making.
For doctors managing high volumes of hypertension patients across Indian outpatient departments, the challenge is rarely about convincing patients to buy a monitor. It is about building a consistent, time-efficient method to collect, review, and act on the numbers a patient brings to the visit, whether on a scrap of paper, a mobile application, or increasingly, through digital health records linked to the Ayushman Bharat Digital Mission. This article lays out a structured, evidence-informed approach that Indian physicians can apply in real-world primary care and cardiology practice.
Understanding Patient-Generated Health Data in Hypertension Care
Patient-generated health data refers to health-related information recorded by patients themselves, outside the clinical setting, and shared with their treating physician. In hypertension care, this most often takes the form of home blood pressure readings taken with a validated digital monitor. Research published in the Annals of Family Medicine, which observed video-recorded hypertension follow-up visits, found that access to home BP readings, regardless of how they were displayed, consistently positioned physicians and patients to assess blood pressure control and make treatment decisions together.
Clinical uncertainty is a major driver of poor hypertension control. A single elevated clinic reading may reflect true uncontrolled hypertension, white coat effect, measurement error, or simple situational stress from travel and waiting times in a busy outpatient department. Home readings, collected over several days in a familiar environment, give physicians a broader and more stable picture of a patient's actual blood pressure pattern. A systematic review published in JMIR mHealth and uHealth examining consumer blood pressure monitors found consistent, though modest, reductions in systolic blood pressure of two to four mm Hg and diastolic blood pressure of one to three mm Hg among patients who used home monitoring compared with usual care alone.
Why This Matters More in the Indian Context
India's hypertension burden is compounded by high rates of undiagnosed disease, particularly in tier two and tier three cities where access to frequent physician visits is limited. Home BP monitoring allows a patient in a smaller town to generate clinically meaningful data between visits, reducing the number of in-person consultations needed purely for blood pressure review and freeing physician time for patients who genuinely need in-clinic evaluation. This is particularly relevant given India's physician-to-population ratio, where primary care doctors and cardiologists alike face significant time pressure per patient encounter.
Why Doctors Often Under-Use Home BP Data
Despite growing patient adoption of home monitors, several structural and behavioural barriers keep this data from being used effectively in Indian clinical practice.
- Fragmented data formats: readings arrive as handwritten diaries, mobile app screenshots, or verbal recall, none of which integrate easily with electronic health records.
- Time pressure during consultations: reviewing scattered paper logs during a short outpatient visit adds friction rather than clarity.
- Uncertainty about data reliability: doctors are often unsure whether the patient used a validated device, the correct cuff size, and proper technique.
- Lack of a standard protocol: without a fixed number of readings and a defined averaging method, doctors and patients interpret trends inconsistently.
The Annals of Family Medicine study on EHR-integrated visualization tools found that when home and clinic BP readings were displayed together on a single graph alongside a medication timeline, physicians could review trends and connect them to treatment changes noticeably faster than when relying on paper lists, without adding more time to the visit meaningfully.
What Doctors Should Look For When Reviewing Home BP Data
Reviewing home BP data effectively is a skill distinct from reading a single clinic value. Certain patterns carry specific clinical meaning and deserve deliberate attention during a follow-up visit.
- Consistent elevation across morning and evening readings, suggesting genuine uncontrolled hypertension rather than an isolated clinic spike.
- High clinic readings paired with normal home readings, a pattern consistent with white coat effect that may prevent unnecessary medication escalation.
- Normal clinic readings paired with elevated home readings, known as masked hypertension, which is easy to miss without home data and carries real cardiovascular risk.
- Wide day-to-day variability, which may point to inconsistent medication adherence, irregular sleep, dietary sodium swings, or measurement technique errors.
- A gradual downward or upward trend aligned with a recent medication change, which helps confirm whether a dose adjustment is working as intended.
Systolic blood pressure can vary by as much as 60 mm Hg within a single day due to normal physiological fluctuation, activity, and stress. This is precisely why isolated readings mislead and why trend-based review of patient-generated data is clinically superior for most stable hypertension patients.
Building a Practical In-Clinic Workflow for Reviewing Home BP Data
A structured, repeatable workflow allows Indian physicians to extract clinical value from home BP data without extending consultation time. Based on observed best practices from clinical workflow research, the review process can be broken into a short sequence of steps.
Step One: Set Clear Instructions Before the Visit
Patients should be advised, ideally through a WhatsApp reminder, SMS, or verbal instruction at the previous visit, to record blood pressure twice in the morning before medication and twice in the evening for seven consecutive days before the follow-up appointment. The first day is typically discarded, and the remaining readings are averaged, consistent with international home BP monitoring guidance adapted for Indian practice.
Step Two: Standardize How Data Reaches the Clinic
Where possible, physicians should encourage patients to enter readings into a digital format rather than a paper diary, whether through a hospital patient portal, a simple spreadsheet, or a health record linked through the Ayushman Bharat Digital Mission. Digitized data is faster to review, easier to trend over multiple visits, and reduces transcription error at the point of care.
Step Three: Review Trends Before Discussing Medication
Rather than reading numbers aloud one by one, physicians benefit from scanning the full data set first to identify the overall pattern, then discussing that pattern with the patient in plain language. This approach mirrors what clinical observation studies found to be faster and to support clearer shared decision-making than a line-by-line reading of paper logs.
Step Four: Connect the Trend to the Treatment Timeline
When a medication change occurred since the last visit, reviewing the BP trend against the date that change was made helps confirm whether the current regimen is working, whether a dose needs titration, or whether side effects reported by the patient align with a genuine reduction in blood pressure.
Using Home BP Data to Guide Treatment Decisions
Once a reliable pattern is established, home BP data can directly inform several categories of clinical decisions that doctors in Indian outpatient settings routinely face.
- Confirming a new hypertension diagnosis in a patient whose clinic readings are borderline, avoiding both overtreatment from the white coat effect and undertreatment from masked hypertension.
- Deciding whether to intensify therapy in a patient whose home readings remain persistently above target despite an existing regimen, addressing the well-documented problem of clinical inertia in hypertension care.
- Identifying a patient whose home readings have dropped too low, particularly relevant in elderly patients or those on multiple antihypertensive agents, where overtreatment risk is real and often underappreciated.
- Supporting conversations about adherence, since a pattern of inconsistent readings or values that spike on certain days of the week often opens a more productive discussion than directly asking a patient whether they take their medication regularly.
The Digital Healthcare Research program under the Agency for Healthcare Research and Quality, which funded the development of an EHR-integrated blood pressure visualization tool, found that this kind of clinical decision support eased cognitive load for physicians while improving the speed and clarity of the shared decision-making process with patients. While this research was conducted internationally, the underlying principle applies directly to Indian practice: presenting home and clinic BP data together, ideally on a shared screen the patient can also see, strengthens both the accuracy and the collaborative nature of the treatment decision.
It is worth noting that the clinical evidence base, while consistently positive for blood pressure reduction, remains less definitive on long-term outcomes such as reduced hospitalization or mortality. Physicians should treat home BP monitoring as a valuable decision-support input rather than a replacement for comprehensive cardiovascular risk assessment.
Strengthening the System Around Home BP Monitoring
Sustained clinical benefit from patient-generated BP data depends on infrastructure and habits that extend beyond any single consultation.
- Recommend only validated devices: doctors should guide patients toward BP monitors that appear on recognized validated device lists, since accuracy varies significantly between brands and models regardless of price.
- Check technique at least once: observing a patient measure their own blood pressure, even briefly, often reveals correctable errors in cuff placement, arm position, or timing relative to caffeine and physical activity.
- Use digital tools where feasible: hospital portals, simple mobile applications, or ABDM-linked health records reduce the friction of reviewing weeks of scattered paper data during a short visit.
- Configure the consultation room for shared viewing: where digital BP trends are used, positioning the screen so both physician and patient can see it supports the kind of joint sense-making that clinical workflow studies have associated with faster, clearer decisions.
- Reinforce the value of the effort: patients who see their physician actively reviewing and acting on data they collected are more likely to continue the habit consistently.
For associations, hospital groups, and healthcare institutions building patient engagement programs around non-communicable disease management, platforms like HealthVoice offer a space where physicians and medical associations can share practical protocols, discuss real-world implementation challenges around home BP monitoring, and highlight initiatives that are improving hypertension control across Indian practices. This kind of structured professional exchange helps translate individual clinical experience into broader, more consistent standards of care.
Conclusion
Home blood pressure monitoring has moved from a patient convenience to a clinically meaningful source of decision-support data, particularly relevant given the scale of India's hypertension burden and the constraints on physician time in busy outpatient settings. The evidence is consistent on one point: home BP data, when reviewed through a structured workflow rather than glanced at informally, helps physicians identify white coat effect and masked hypertension, address clinical inertia, and reach treatment decisions collaboratively with patients, often without extending visit length. As India's digital health infrastructure matures through initiatives like the Ayushman Bharat Digital Mission, the opportunity for doctors to build reliable, low-friction systems around patient-generated BP data will only grow. The physicians who invest in that workflow now are likely to see measurably better hypertension control among their patients over time.
Frequently Asked Questions
Q1: How many home BP readings should a doctor request before a follow-up visit?
Most guidance recommends seven days of readings, taken twice in the morning before medication and twice in the evening, with the first day excluded and the remaining readings averaged to obtain a reliable trend.
Q2: Can home BP data replace clinic BP measurement entirely?
No. Home BP data complements rather than replaces clinic measurement. Clinic readings remain important for initial diagnosis, periodic calibration checks, and situations where device accuracy or patient technique is uncertain.
Q3: How can doctors verify that patient-reported home BP data is accurate?
Doctors can ask patients to bring their monitor for a side-by-side comparison against a validated clinic device, check whether the device model appears on a recognized validated device list, and briefly observe the patient measuring their own blood pressure to review cuff size and posture.
Q4: What is the role of the Ayushman Bharat Digital Mission in managing patient-generated BP data?
ABDM provides the interoperability framework through which patient-generated health data, including home BP readings, can eventually be linked to a patient's Ayushman Bharat Health Account and shared securely with treating physicians across care settings.
Q5: Do Indian patients need an expensive device for reliable home BP monitoring?
No. Reliability depends primarily on validation status and correct cuff size rather than price. Several mid-range upper-arm digital monitors available in India are clinically validated and perform comparably to costlier models when used with proper technique.
 Team Healthvoice
#BloodPressureMonitoring #PatientCare